Personality-Distribution-Analysis-in-AequorTechCTRL-by-Fozan-Ahmed-Memon
Personality Distribution Analysis — Volunteers at AequorTech CTRL
This project analyzes MBTI personality types for volunteering participants at AequorTech CTRL using a curated CSV dataset. The previous synthetic employee-based method has been removed; the analysis now strictly uses the provided participant data.
Dataset
- File:
PersonalityAnalysis/participants_mbti.csv - Columns:
Name, Age, Gender, City, Country, MBTI, Occupation - MBTI codes are normalized to uppercase.
Outputs
- Script:
PersonalityAnalysis/participants_personality_distribution.png - Notebook:
PersonalityAnalysis/notebook_participants_personality_distribution.png
Quick Start (Windows, Python 3.12)
- Install Python:
winget install -e --id Python.Python.3.12 --accept-package-agreements --accept-source-agreements --silent - Upgrade tooling:
"$env:LOCALAPPDATA\Programs\Python\Python312\python.exe" -m pip install --upgrade pip setuptools wheel - Install deps:
"$env:LOCALAPPDATA\Programs\Python\Python312\python.exe" -m pip install -r PersonalityAnalysis/requirements.txt
Run Options
- Script (generate plot):
"$env:LOCALAPPDATA\Programs\Python\Python312\python.exe" PersonalityAnalysis/app.py - Notebook (EDA):
"$env:LOCALAPPDATA\Programs\Python\Python312\python.exe" -m notebook PersonalityAnalysis/MBTI_Personality_Analysis.ipynb - Headless notebook:
"$env:LOCALAPPDATA\Programs\Python\Python312\python.exe" -m notebook PersonalityAnalysis/MBTI_Personality_Analysis.ipynb --no-browser --port 8890
AI Research Context
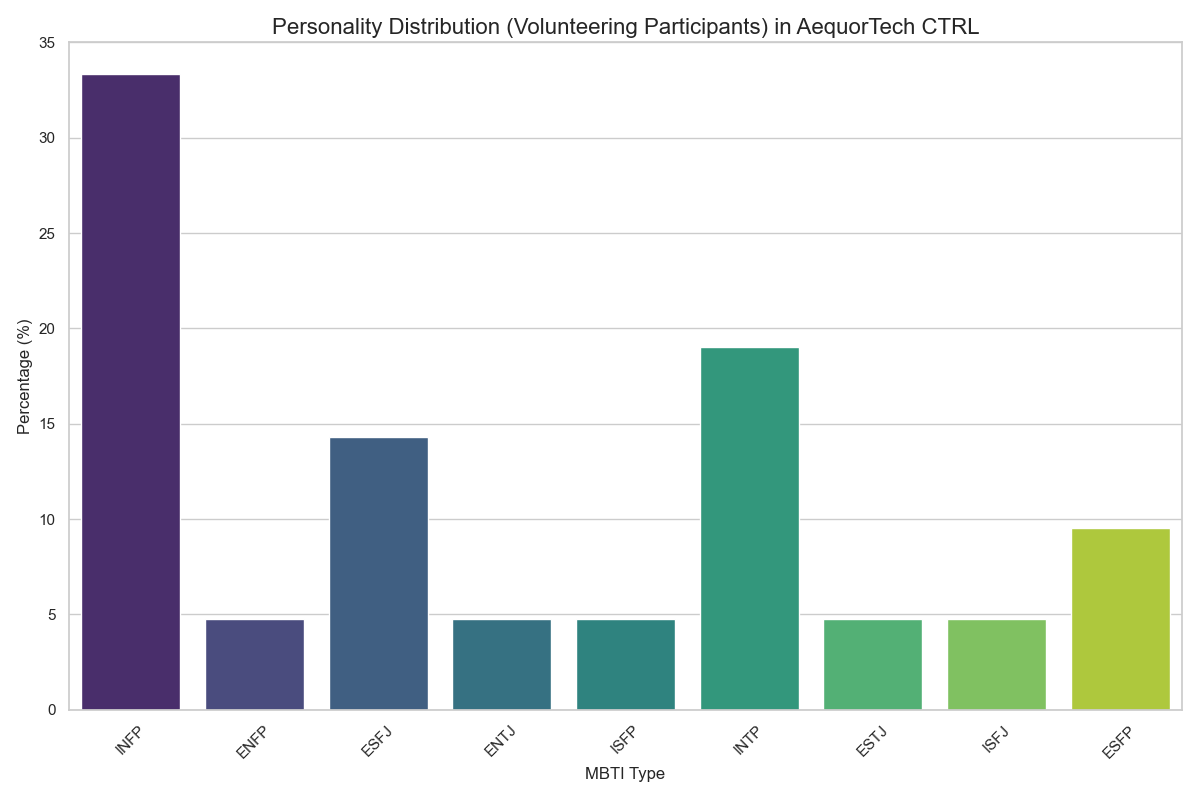
- Goal: Describe MBTI distribution for volunteers to inform team design, engagement, and role alignment.
- Method: EDA-first pipeline — ingest CSV → normalize MBTI → compute counts/percentages → visualize.
- Utilities: Lookup by name and list participants by MBTI in
app.py. - Reproducibility: Deterministic analysis from CSV; reruns yield the same results.
Ethics & Limitations
- Small convenience sample; insights are descriptive, not generalizable.
- MBTI is a self-report typology; avoid stereotyping or prescriptive decisions.
- Maintain voluntariness, privacy, and transparency when expanding the dataset.
Extend the Research
- Add features (e.g., department, tenure, interests) to enable richer analysis.
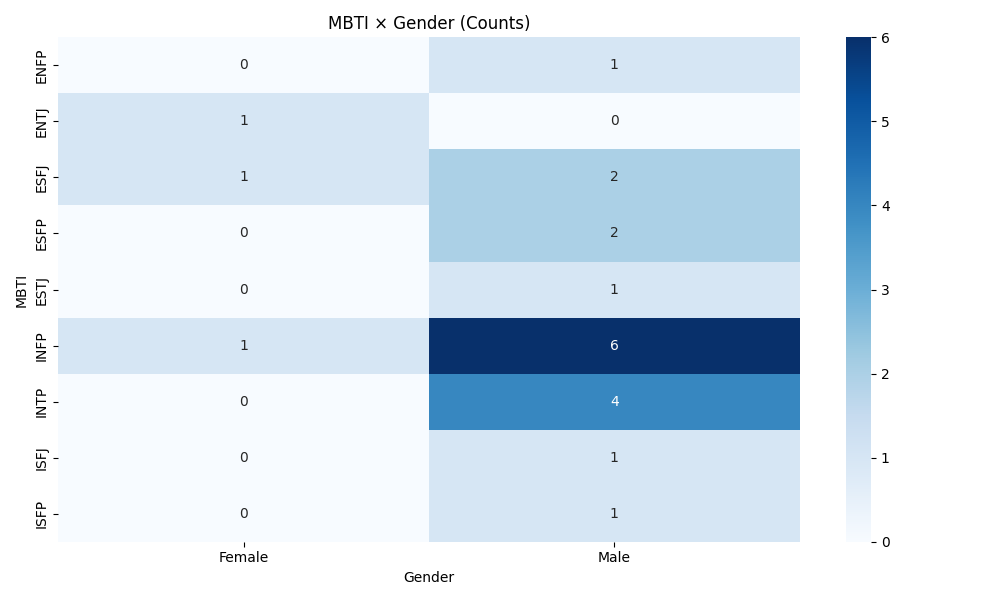
- Explore cross-tabs (MBTI × Gender/Occupation) and age distributions.
- Build an interactive dashboard (e.g., Streamlit) or add modeling (clustering, prediction) when more features are available.
Advanced Notebook — Percent Heatmaps and Grouped Occupations
- Notebook:
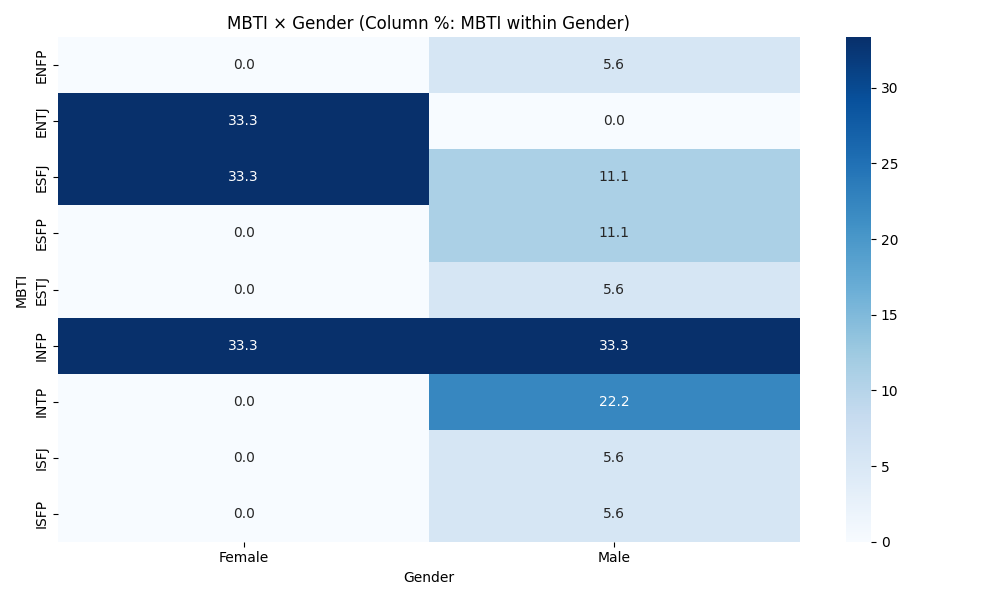
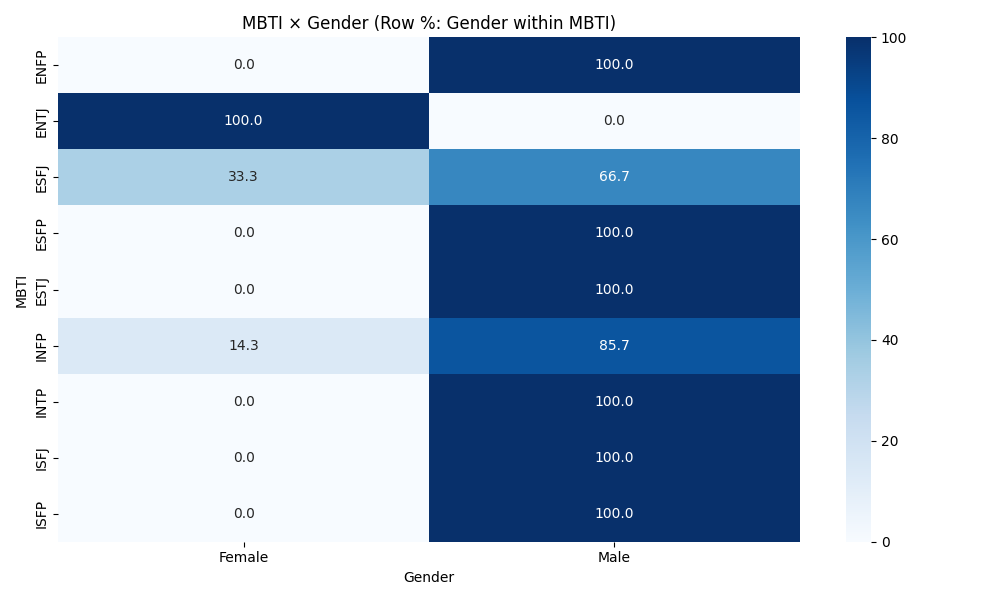
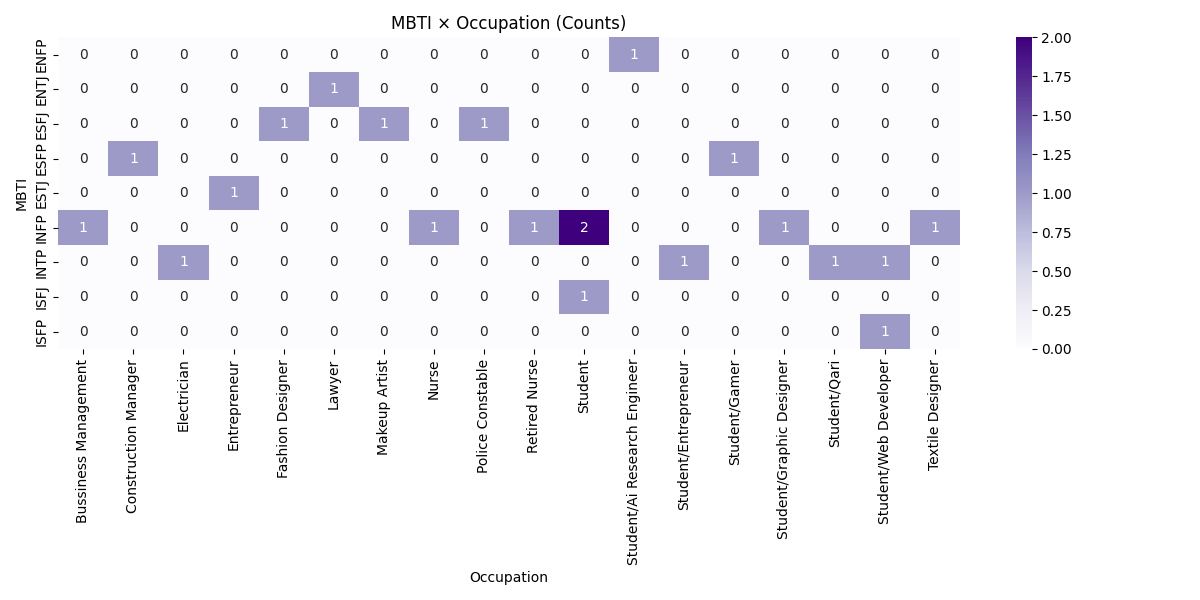
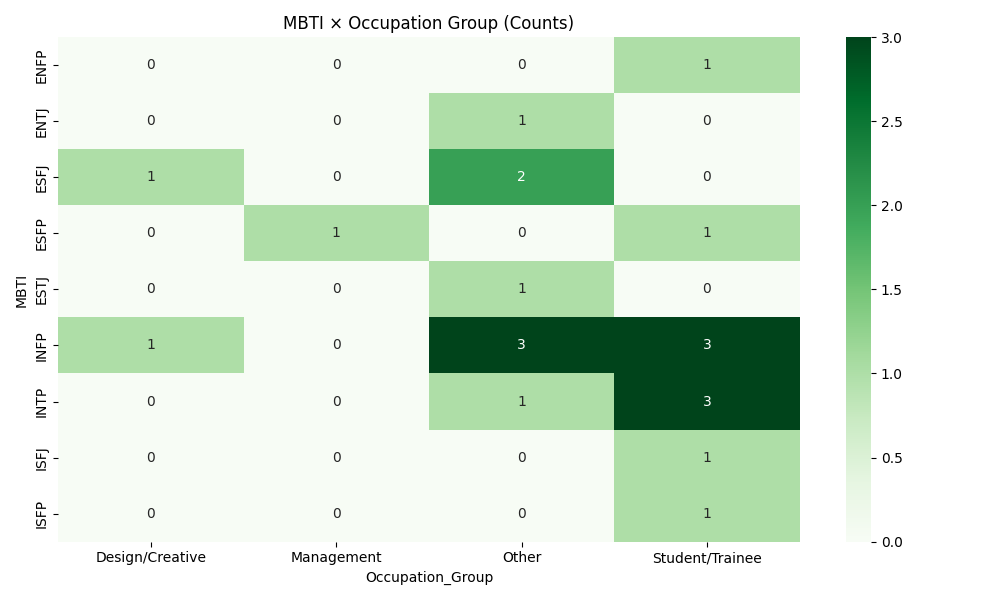
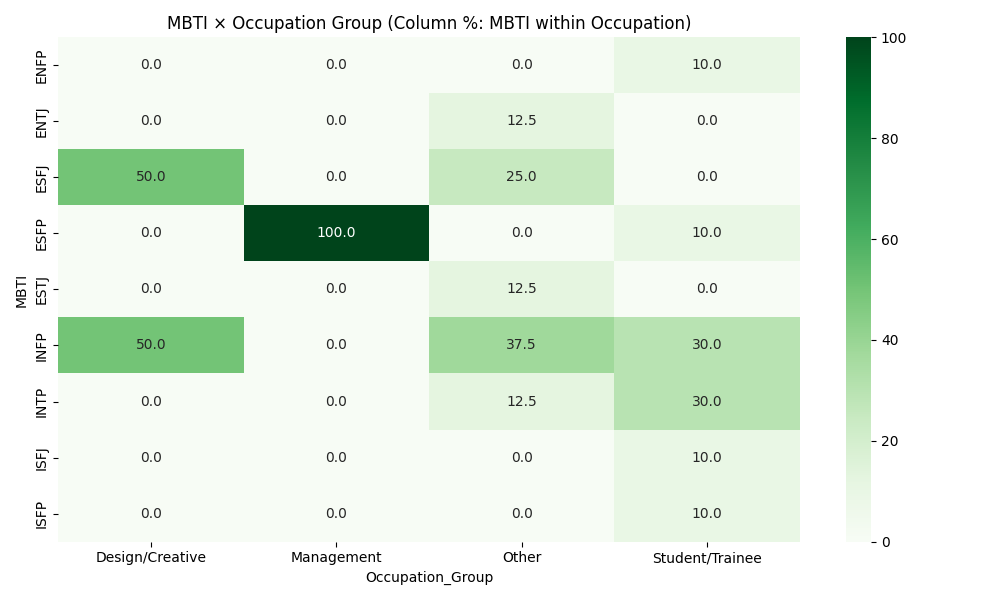
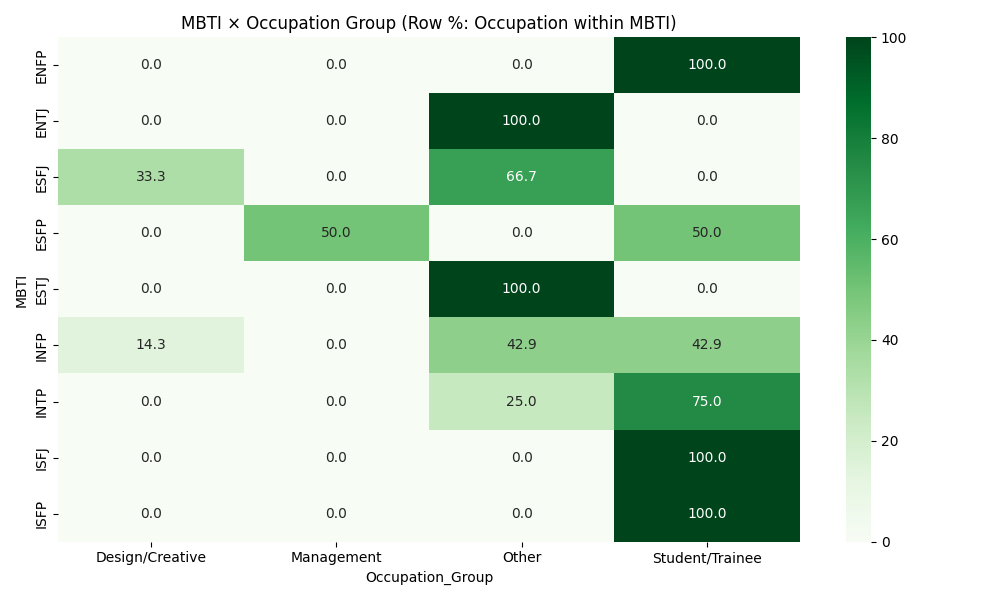
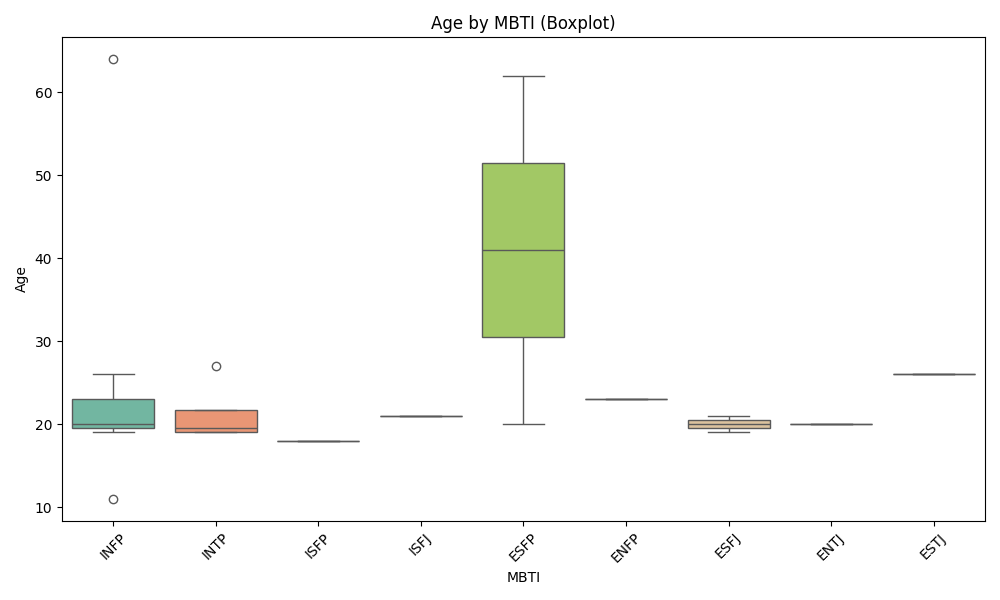
PersonalityAnalysis/MBTI_Personality_Analysis_Advanced.ipynb - Adds grouped occupation categories and percent-based cross-tabs for MBTI × Occupation and MBTI × Gender; includes age-by-MBTI boxplot.
Run Options
- Jupyter UI (serve
PersonalityAnalysis/):- If
pythonis on PATH:python -m jupyter notebook --no-browser --port 8891 --notebook-dir PersonalityAnalysis
- Using Python 3.12 path on Windows:
& "C:\Users\Fozan\AppData\Local\Programs\Python\Python312\python.exe" -m jupyter notebook --no-browser --port 8891 --notebook-dir "c:\Users\Fozan\Desktop\Personality-Distribution-Analysis-in-AequorTechCTRL-by-Fozan-Ahmed-Memon-main\PersonalityAnalysis"
- If
- Headless execution (generates an executed copy and images):
- If
pythonis on PATH:python -m jupyter nbconvert --to notebook --execute PersonalityAnalysis/MBTI_Personality_Analysis_Advanced.ipynb --output PersonalityAnalysis/MBTI_Personality_Analysis_Advanced_executed.ipynb --ExecutePreprocessor.timeout=300
- Using Python 3.12 path on Windows:
& "C:\Users\Fozan\AppData\Local\Programs\Python\Python312\python.exe" -m jupyter nbconvert --to notebook --execute "c:\Users\Fozan\Desktop\Personality-Distribution-Analysis-in-AequorTechCTRL-by-Fozan-Ahmed-Memon-main\PersonalityAnalysis\MBTI_Personality_Analysis_Advanced.ipynb" --output "MBTI_Personality_Analysis_Advanced_executed.ipynb" --output-dir "c:\Users\Fozan\Desktop\Personality-Distribution-Analysis-in-AequorTechCTRL-by-Fozan-Ahmed-Memon-main\PersonalityAnalysis" --ExecutePreprocessor.timeout=300
- If
New Outputs
PersonalityAnalysis/advanced_mbti_occupation_group_heatmap.pngPersonalityAnalysis/advanced_mbti_occupation_group_colpct_heatmap.pngPersonalityAnalysis/advanced_mbti_occupation_group_rowpct_heatmap.pngPersonalityAnalysis/advanced_mbti_gender_heatmap.pngPersonalityAnalysis/advanced_mbti_gender_colpct_heatmap.pngPersonalityAnalysis/advanced_mbti_gender_rowpct_heatmap.pngPersonalityAnalysis/advanced_age_by_mbti.png- Executed notebook:
PersonalityAnalysis/MBTI_Personality_Analysis_Advanced_executed.ipynb
Notes & Tips
- MBTI codes are normalized to uppercase; Age is parsed as numeric where present.
- Occupation grouping uses simple keywords (e.g., engineering/tech, design/creative, student/trainee). You can refine categories as data grows.
- If
nbconvertis missing:python -m pip install nbconvert. Ifjupyteris missing:python -m pip install notebook.
Visual Gallery
- Script output — Distribution:
- Advanced notebook — Gender:
- Advanced notebook — Occupation (raw):
- Advanced notebook — Occupation Group:
- Advanced notebook — Age: